THOMAS HAGOS · 2026 MUSA 30-DAY MAP CHALLENGE · DAY 03 / POLYGONS
Africa, to Scale
Continent outlines compared at one consistent area scale.
Africa is the reference in five comparisons. In the sixth, the perspective reverses: its outline crosses a country-colored Asia. The shapes move and rotate, but their calculated areas stay the same.
29.90m km²Africa’s calculated surface area
59.2%South America / Africa
67.9%Africa / Asia
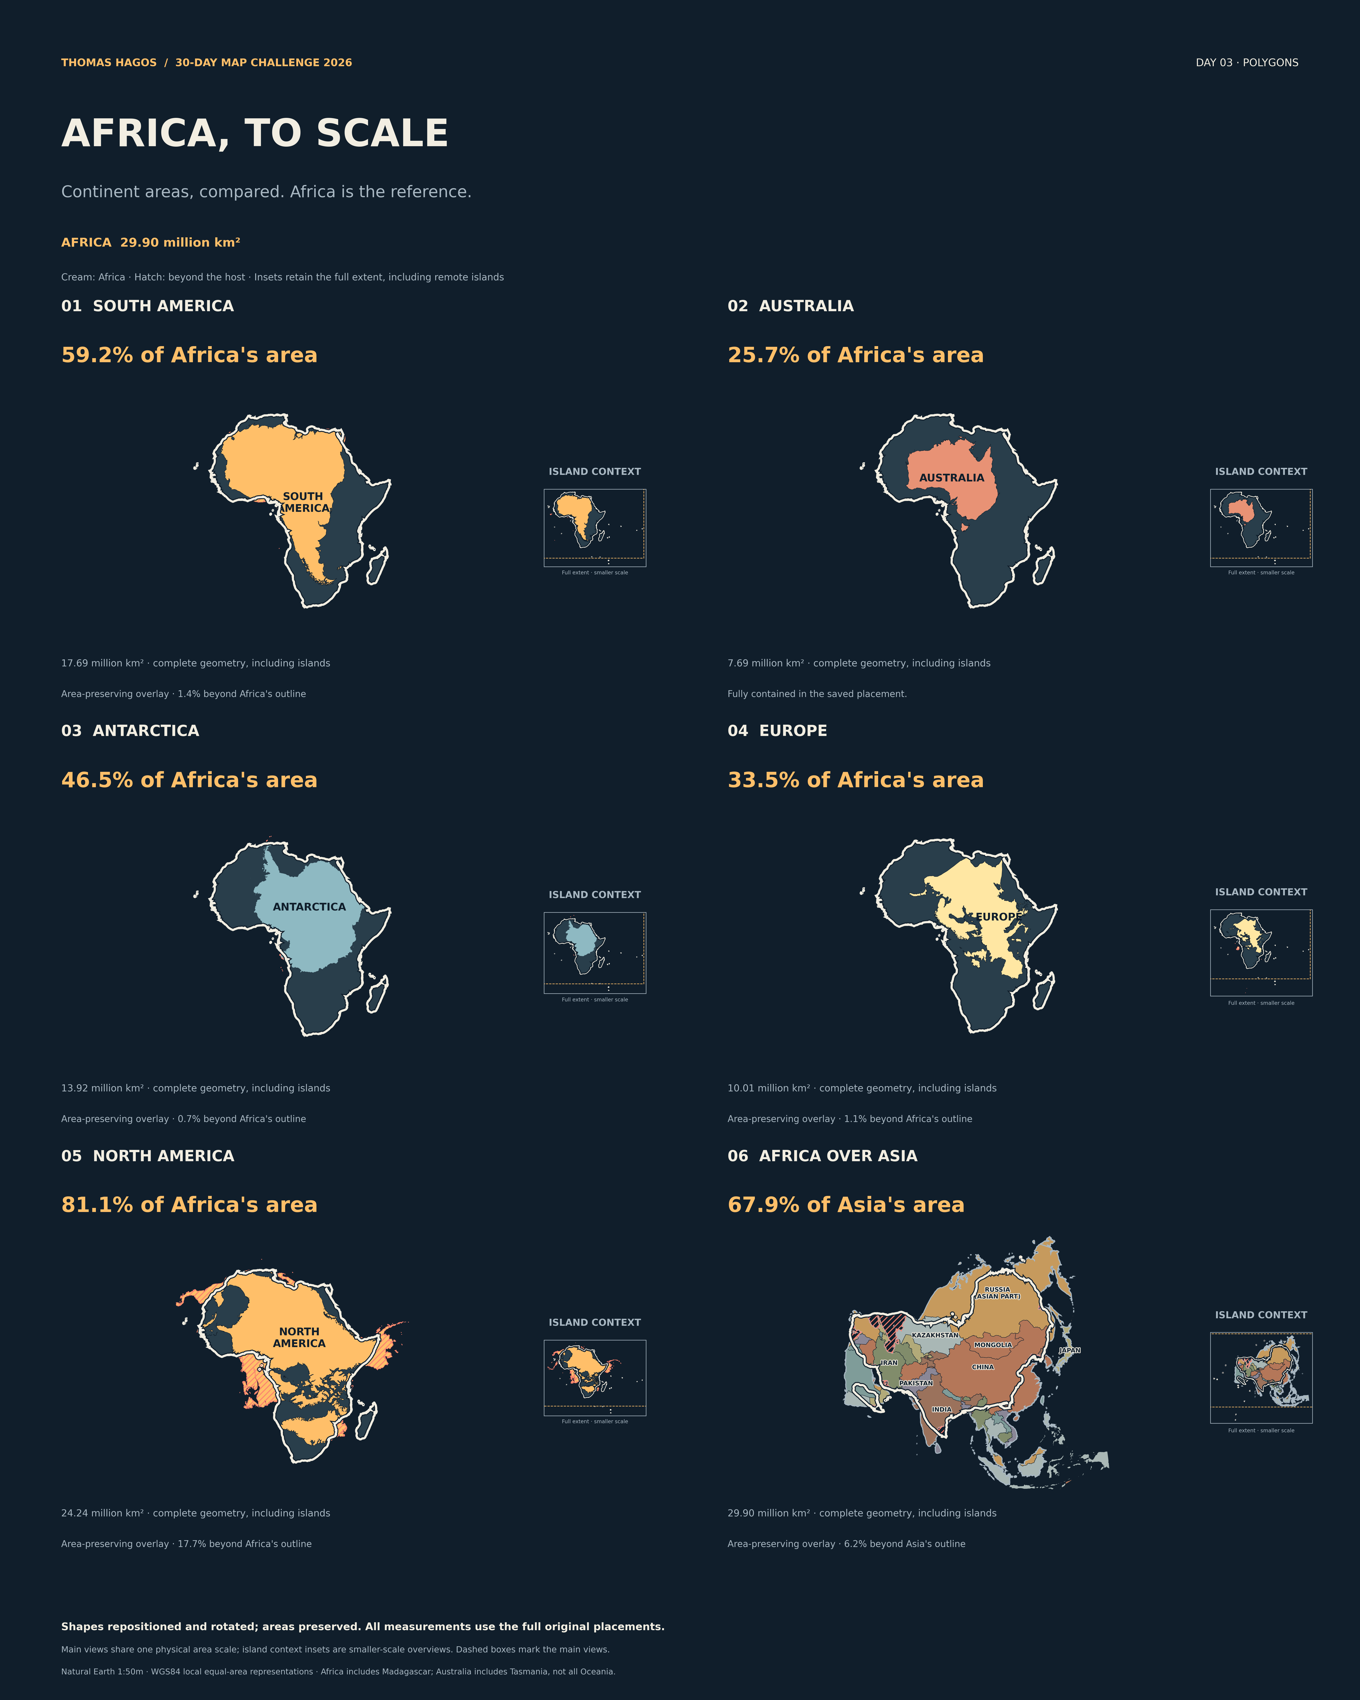 Main panels share the same physical area scale. Smaller-scale island context insets retain the full original extent; dashed boxes identify the main views. The cream outline identifies Africa; hatching marks portions beyond the host outline.
For the small screen
Six individual panels lead with each area comparison. Each panel uses one area scale within its overlay; view scales vary across slides. Full-extent island context is retained in the labeled inset.
Area and shape tell different stories
A smaller area does not guarantee that one intact outline will nest inside another. Australia is fully contained in its saved placement. The others retain visible protrusions: the map reports the measured share inside and beyond the host. It makes no claim that every continent literally fits inside Africa.
The comparison, reversed
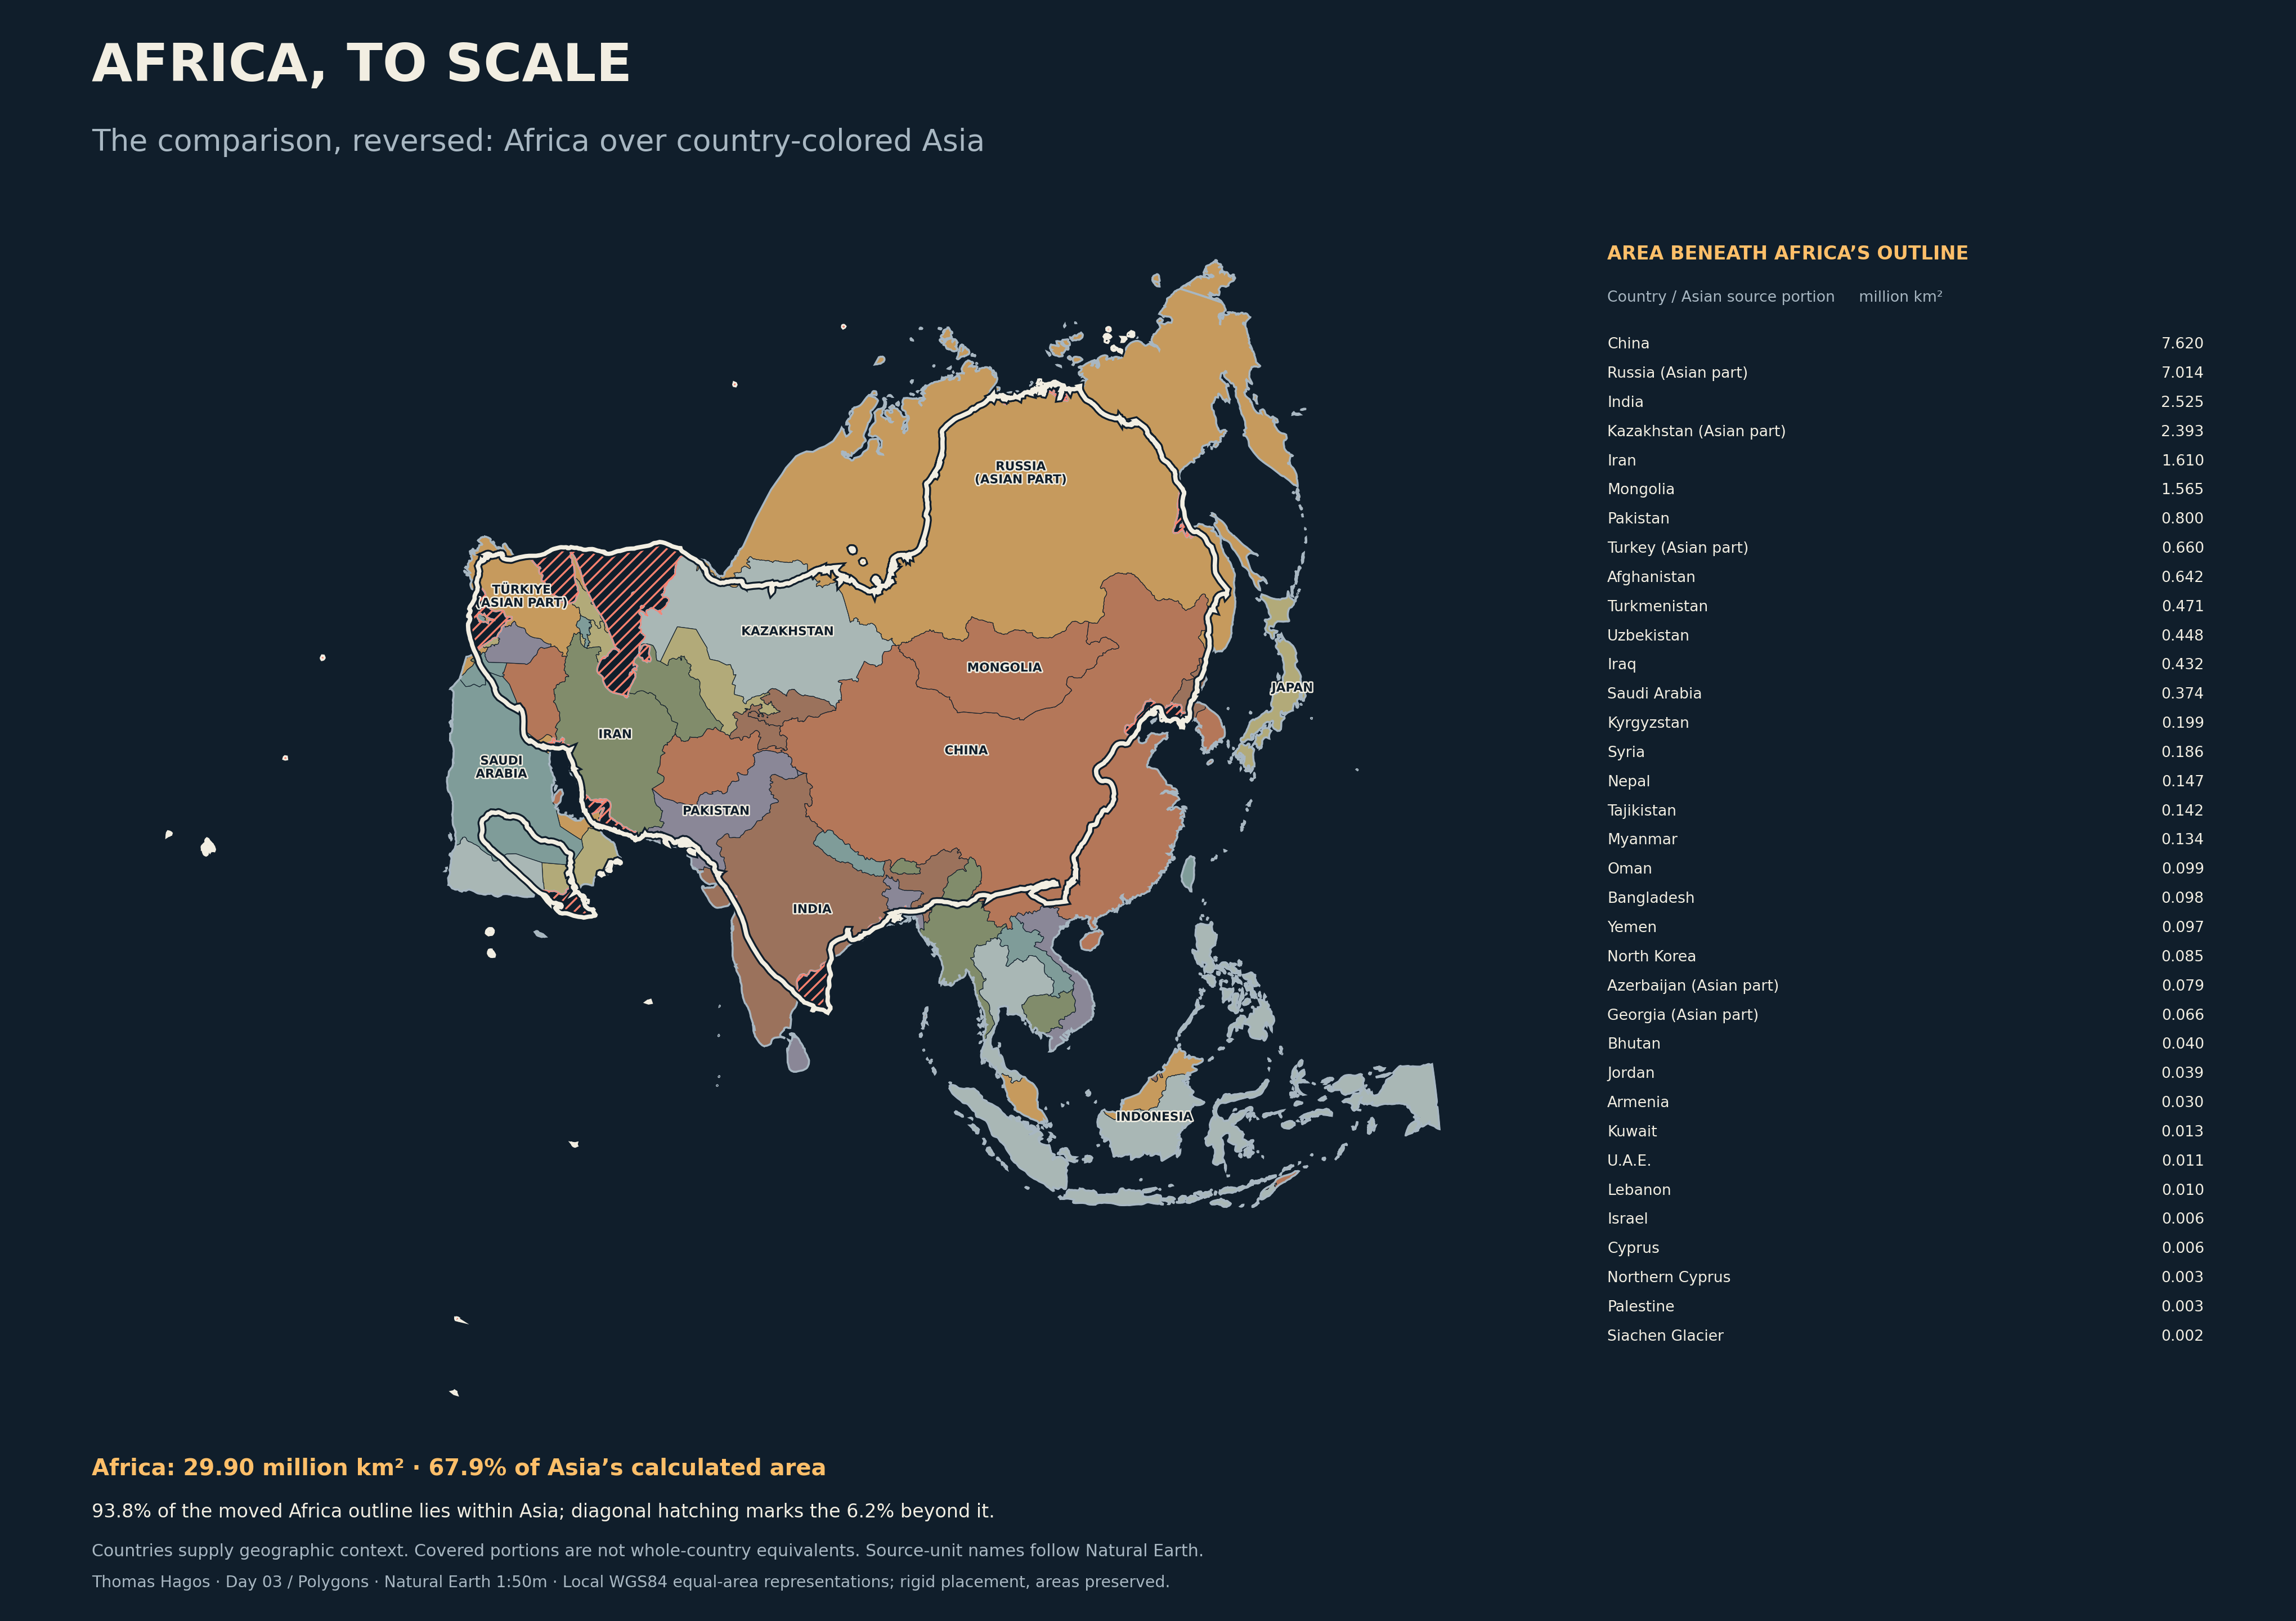 93.8% of the moved Africa outline falls within Asia; 6.2% extends beyond it. Country colors give geographic context.
The table describes portions beneath Africa’s repositioned outline. Split countries refer to their Asian portions. These are not whole-country equivalents.
| Country / territory | Extent | Covered km² | Share of source piece |
|---|
| China | Source country/territory | 7,619,976 | 81.3% |
| Russia | Asian portion | 7,014,355 | 53.8% |
| India | Source country/territory | 2,525,124 | 80.2% |
| Kazakhstan | Asian portion | 2,392,956 | 92.8% |
| Iran | Source country/territory | 1,610,024 | 99.3% |
| Mongolia | Source country/territory | 1,564,511 | 100.0% |
| Pakistan | Source country/territory | 799,577 | 91.6% |
| Turkey | Asian portion | 660,081 | 87.2% |
| Afghanistan | Source country/territory | 641,833 | 100.0% |
| Turkmenistan | Source country/territory | 471,029 | 100.0% |
| Uzbekistan | Source country/territory | 448,019 | 100.0% |
| Iraq | Source country/territory | 432,480 | 98.9% |
| Saudi Arabia | Source country/territory | 374,031 | 19.5% |
| Kyrgyzstan | Source country/territory | 198,928 | 100.0% |
| Syria | Source country/territory | 185,959 | 100.0% |
| Nepal | Source country/territory | 146,977 | 100.0% |
| Tajikistan | Source country/territory | 142,395 | 100.0% |
| Myanmar | Source country/territory | 134,180 | 20.3% |
| Oman | Source country/territory | 99,186 | 31.9% |
| Bangladesh | Source country/territory | 97,929 | 72.4% |
| Yemen | Source country/territory | 96,889 | 21.4% |
| North Korea | Source country/territory | 85,412 | 69.7% |
| Azerbaijan | Asian portion | 78,829 | 100.0% |
| Georgia | Asian portion | 66,480 | 100.0% |
| Bhutan | Source country/territory | 39,811 | 100.0% |
| Jordan | Source country/territory | 38,619 | 43.5% |
| Armenia | Source country/territory | 29,591 | 100.0% |
| Kuwait | Source country/territory | 13,317 | 76.9% |
| United Arab Emirates | Source country/territory | 11,022 | 15.5% |
| Lebanon | Source country/territory | 10,009 | 100.0% |
| Israel | Source country/territory | 5,949 | 27.0% |
| Cyprus | Source country/territory | 5,707 | 100.0% |
| Northern Cyprus | Source country/territory | 3,470 | 100.0% |
| Palestine | Source country/territory | 2,667 | 42.1% |
| Siachen Glacier | Source country/territory | 2,118 | 100.0% |
Geography and method
Natural Earth 1:50m supplies the outlines. Each continent uses a locally centered WGS84 equal-area representation, normalized minutely to its ellipsoidal surface area. After preparation, only rotation and translation are used. No display simplification or clipping is applied.
Africa includes Madagascar and the saved regional island grouping. Australia includes Tasmania, rather than all Oceania. Europe and Asia use an explicit saved division through transcontinental countries. Antarctica includes historical perennial ice shelves, excluding seasonal sea ice. Enclosed interior rings are filled consistently; the measure is polygon surface area, not dry-land area.
These local projections support an area comparison; moving the shapes does not produce exact geographic relocation on the globe. Generalized boundaries and the historic Antarctic extent limit geographic precision.